Causal-loop-diagram is a Design Thinking tool that teams can use to create a shared understanding of how the various variables interact, leading to the existing performance. Teams calculate process-performance during grasping-current-condition step. This step helps the team to drive data, observations, and modeling of how the focus-process performs.
Operating according to the desired-operating-pattern will generate data that the team analyzes for learning on the merits of these changes. The process-metric measures the extent the team performs according to the desired-operating-pattern. There is a hypothesis that the team comes up with, which is: “the performance-metric could be enhanced by improving this process-metric”. Process-metric can be affected by the team, while the performance-metric is a lagging one.
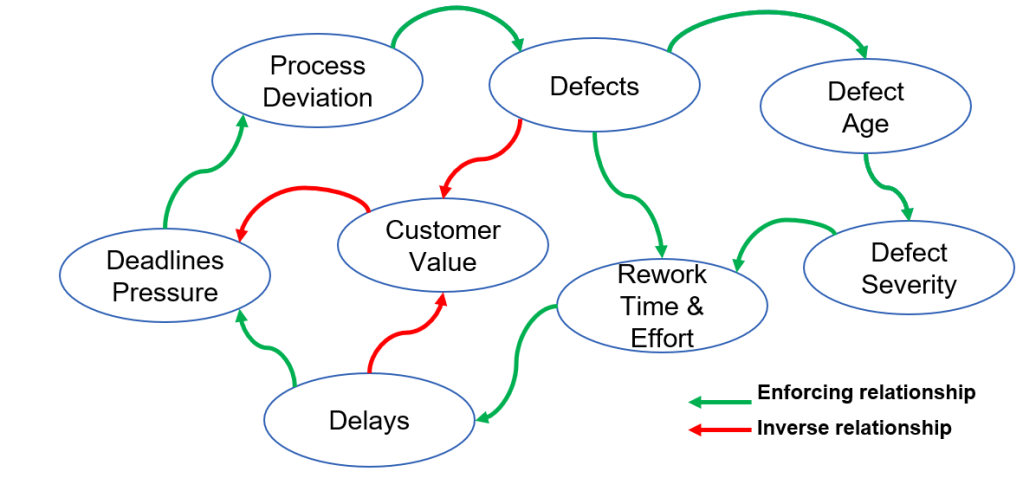
To help coming up with the hypothesis that supports desired-operating-pattern, the team can use causal-loop-diagram to make sense of how the various variables of the system interact. For example, in the above diagram the team decided to address ‘process-deviation’ by implementing new work standard. The hypothesis is that the better the work-standard the less is the process-deviation, the latter causes defect escape and other ramifications as shown in the diagram.
While it is reviewed by their manager, the desired-operating-pattern is designed by the team who is close to the action. It takes some imagination to arrive at a desired-operating-pattern, the causal-loop-diagram creates a shared mental model. This would lead to more innovative ideas for designing the desired-operating-pattern supported with the hypothesis gleaned from the causal-loop-diagram.
